


Motivation to write this story:
Yesterday we deployed a code in prod build and checking each functionality suddenly the web page is hanged we don't know what is causing the issue,
we verified CPU is taking 100% usage. so stopped all the services and started again the same issue came.
There are 100s of API's are present but we which one is causing the problem
After integrating the Flask monitor dashboard we find out the queries are eating the all resources by finding the API response time in the dashboard
For integration, it took only 10 minutes into the existing flask project that is the beauty of flask plugins ( flask_monitoringdashboard )
Installation with pip
pip install flask_monitoringdashboard
Adding the extension to your Flask app is simple:
from flask import Flask
import flask_monitoringdashboard as dashboard

app = Flask(__name__)
dashboard.bind(app)
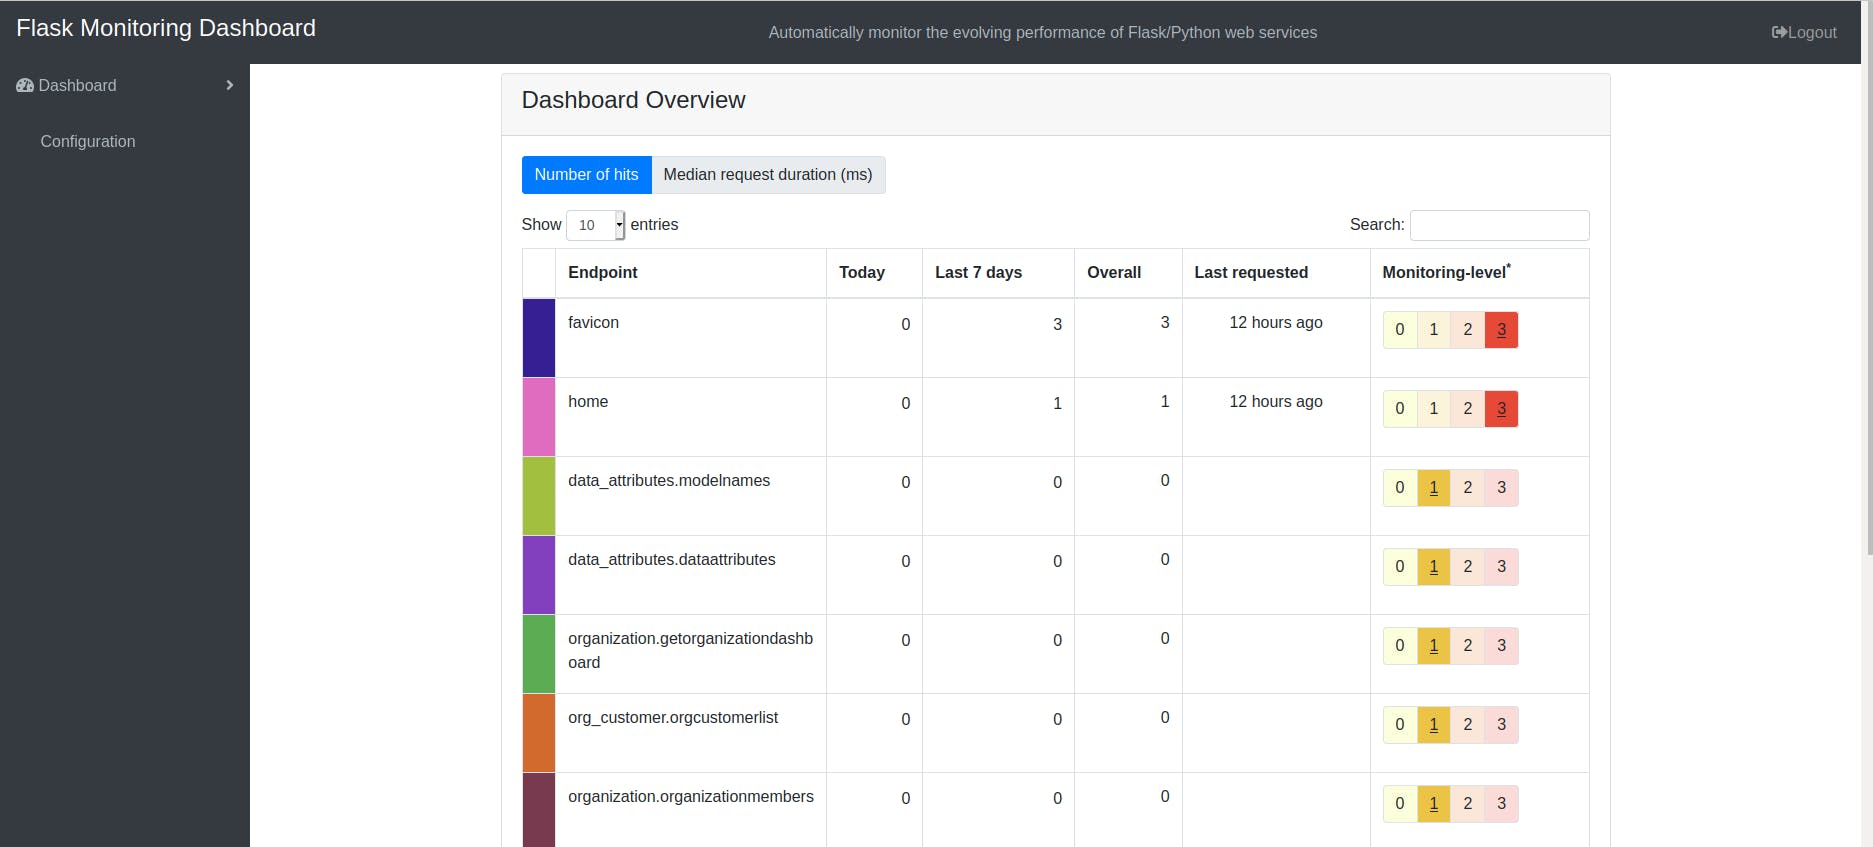
The library is smart enough to give each and every information which we needed in single line integration
- To show all list of API endpoints
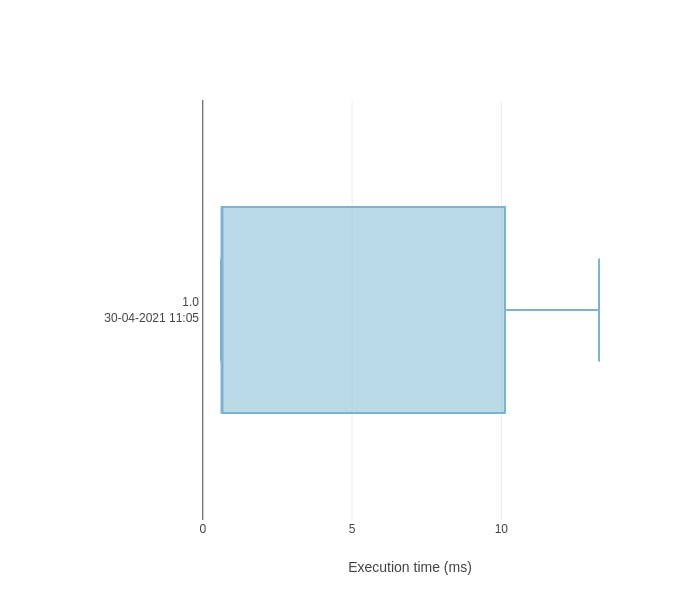
- Graphical view of each request and response time
- No of times the API is called
- Average Response time
- Performance log
- API response time log export
- Comparision to last week API response time and current after code changes
- Directly integrate to an existing project using the. git URL for versioning
- We can set the login differentiation like admin and customer
- By default, it will use SQLite database
- work with large project & small project like blueprint with restful
Default route
http://127.0.0.1:5000/dashboard
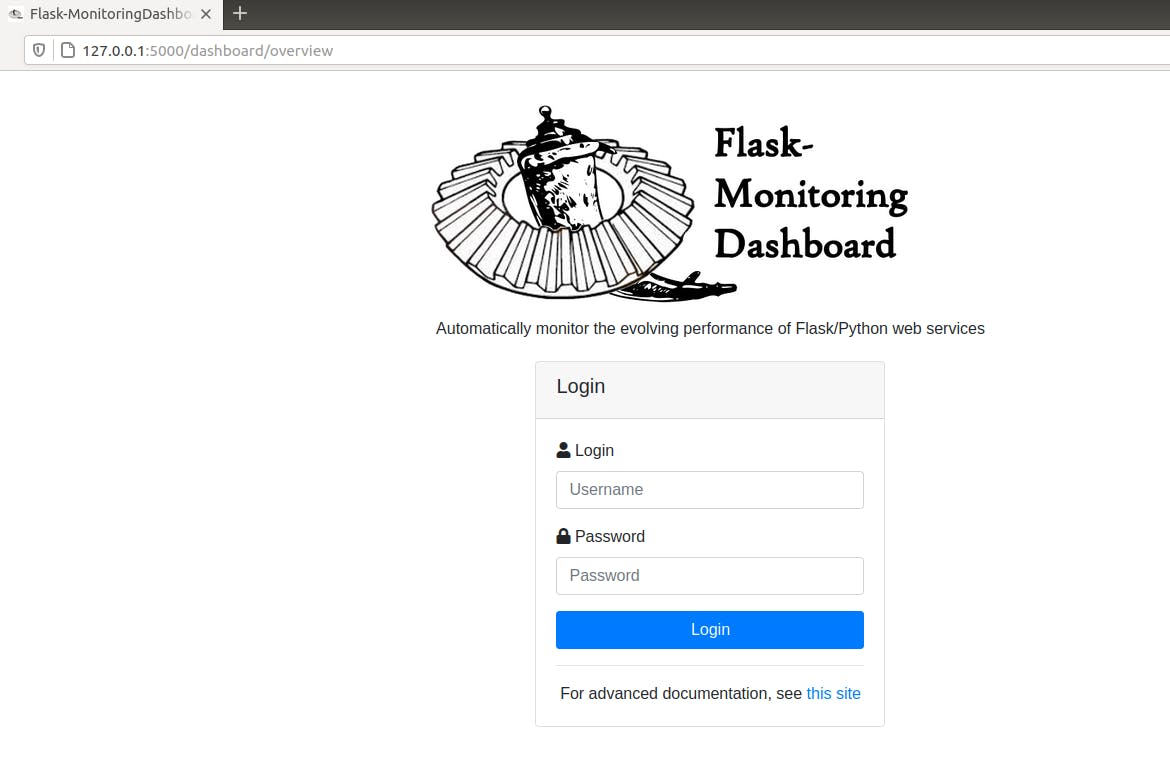
Default Login
username: admin
password: admin
Dashboard: